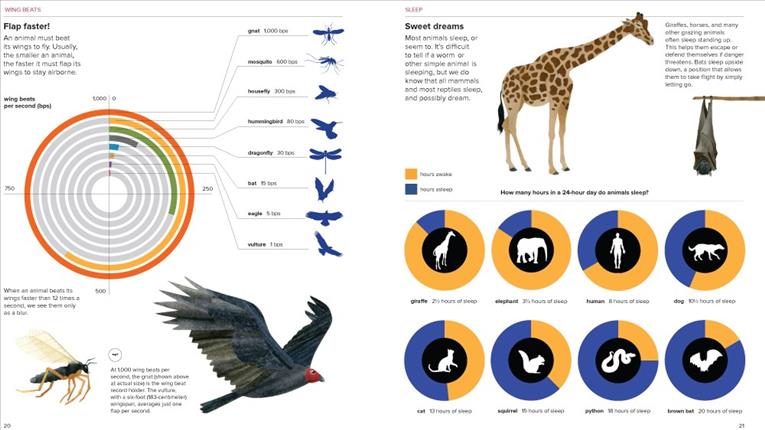
  | Full Text Reviews: Booklist - 10/01/2016 *Starred Review* Caldecott Honor–winner Jenkins is well-known for his paper collage artwork and for deploying fascinating animal facts in easily digestible picture book formats. This volume, composed of a series of captivating infographics, ups the ante. Each spread spotlights a different topic, such as the expected standards of size and speed, as well as more obscure features, like the spread comparing tongue lengths, both in actual measurements and relative to body size. The graphics are paired with plenty of explanatory text that defines key terms, like decibel and biomass, and snappy collage illustrations of some creatures. The pages highlighting animals that thrive in extreme temperatures features a handy thermometer chart with emperor penguins on the cold bottom and Pompeii worms at the steamy top, and special attention is given to tardigrades, microscopic creatures that can live anywhere, even in space. There’s a wealth of information here, organized so cleverly that it’s easy to see almost immediately what the images are communicating, and the accompanying factoids and scientific concepts are often surprising. The intriguing and engaging format of this title is stimulating on a variety of levels, and the approach should appeal to a wide range of students, especially visual learners, something for which educators will be grateful. A brilliantly executed take on a perennially high-interest topic. - Copyright 2016 Booklist. School Library Journal - 10/01/2016 Gr 2–6—Jenkins combines cut-and-torn-paper illustrations with infographics to present highly engaging visual comparisons from the animal kingdom. Ranging from one to four pages in length, the graphic sections feature careful layouts that convey well-chosen and fascinating data. Clean lines and abundant white space lead readers to absorb the information without strain or confusion. In one example, a horizontal bar graph examines the speeds of 15 animals, each identified by name and a silhouette figure. In addition, illustrations highlight two particular examples with captions. Varied graph formats demonstrate each topic to maximum effect. Concentric circles show the surprising differences between wing speeds of hummingbirds and gnats. Cut-paper horns are neatly placed within a bar graph of horn lengths. There's even a logic tree outlining the decision-making process of an armadillo. Scales are clearly noted, even when they shift on the following page, as in the impressive four-page look at the deadliest animals that reveals the mosquito's clear dominance. Estimated data is always identified, such as numbers representing the combined biomass of species. In some cases, two graphs are used to offer different perspectives on the topic: a horizontal bar graph details tongue lengths, for example, while on the facing page a vertical depiction compares those lengths to the size of each animal (and the bars are cleverly rounded to resemble tongues). VERDICT Compelling visual presentation makes the information accessible and exciting. Highly recommended for all science collections.—Steven Engelfried, Wilsonville Public Library, OR - Copyright 2016 Publishers Weekly, Library Journal and/or School Library Journal used with permission. Loading...
|