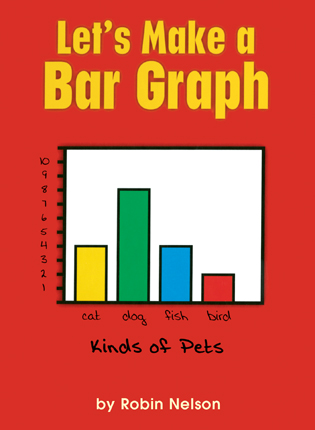
  | Let's make a bar graph (First step nonfiction. Graph it!) Author: Nelson, Robin | |
| Price: $25.81 | ||
Summary:
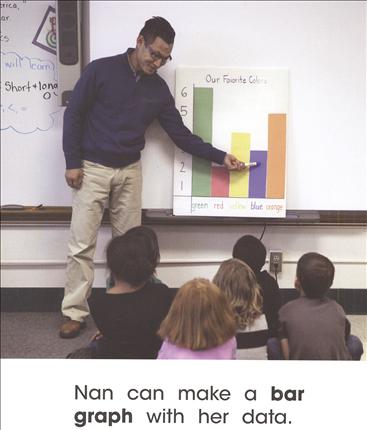
Nan surveys her class to find out what types of pets they have. See how she creates a bar graph to share her results.![]() Download a Teacher's Guide
Download a Teacher's Guide
| Reading Counts Information: Interest Level: K-2 Reading Level: 3.10 Points: 1.0 Quiz: 59914 | ||
Common Core Standards
Grade 2 → Math → 2.MD Measurement & Data
Reviews:
School Library Journal (11/01/12)
Booklist (08/01/12)
Full Text Reviews:
Booklist - 08/01/2012 The Graph It! series from the First Step Nonfiction brand explains the basic components of graphs to probably the youngest set capable of grasping the concepts. Using big, clear photos on every page, with a simple line of text below, the authors take readers through every incremental step. In Let’s Make a Bar Graph, we are introduced to Nan, a girl who “wants to ask her classmates about their pets.” She tallies the answers with straight lines on paper (“The answers are her data”) before drawing out the horizontal and vertical axes of her graph. Four pages are devoted to drawing the first shape—yes, it’s very drawn out, but kids will appreciate it when Nan proudly displays her brightly colored graph before the class. Each title logically ends with questions that ask the reader to draw information from the very graph being discussed, making these great kickoff points to classroom discussion. - Copyright 2012 Booklist.
School Library Journal - 11/01/2012 K-Gr 2—These basic books provide step-by-step instructions for creating graphs. Nelson features a set of characters with a task to accomplish. For example, in Picture Graph, three children "wanted to show how many apples they picked." The instructions are clearly written and the illustrations that support the creation of the graphs are helpful. The photos attempting to show the kids in real-life situations can look a bit staged. Circle Graph is the weakest of the set, as it is too simplistic; the data is too easily divided to give students a full understanding. Each title contains a spread that tests children's knowledge and another that gives them a recap of how to create the featured graph or more information. The questions require appropriate advanced math thinking and will challenge the youngest in the targeted age group. Overall, these books provide strong simple instructions and will give teachers solid supplemental material when teaching graphing. - Copyright 2012 Publishers Weekly, Library Journal and/or School Library Journal used with permission.