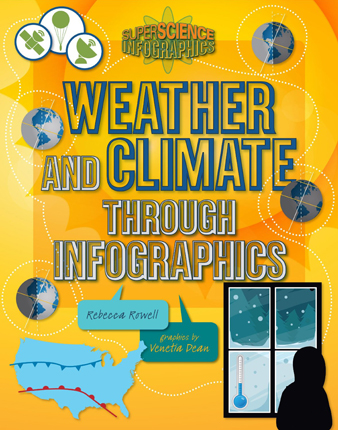
Weather and climate through infographics (Super science infographics) Author: Rowell, Rebecca | ||
Price: $27.49 |
Summary:
This book covers weather and climatology, including weather-related disasters, how weather impacts us as humans, what patterns occur with weather and within different climates, and how we measure and predict those things.
Illustrator: | Dean, Venitia |

Accelerated Reader Information: Interest Level: MG Reading Level: 5.60 Points: .5 Quiz: 160208 | Reading Counts Information: Interest Level: 3-5 Reading Level: 5.40 Points: 3.0 Quiz: 62056 | |
Common Core Standards
Grade 3 → Reading → RI Informational Text → 3.RI Craft & Structure
Grade 3 → Reading → RI Informational Text → 3.RI Integration of Knowledge & Ideas
Grade 3 → Reading → RI Informational Text → Texts Illustrating Complexity, Quality, & Range of
Grade 3 → Reading → CCR College & Career Readiness Anchor Standards fo
Grade 4 → Reading → RI Informational Text → 4.RI Craft & Structure
Grade 4 → Reading → RI Informational Text → 4.RI Integration of Knowledge & Ideas
Grade 4 → Reading → RI Informational Text → 4.RI Range of Reading & Level of Text Complexity
Grade 4 → Reading → RI Informational Text → Texts Illustrating the Complexity, Quality, & Rang
Grade 4 → Reading → CCR College & Career Readiness Anchor Standards fo
Grade 5 → Reading → RI Informational Text → 5.RI Craft & Structure
Grade 5 → Reading → RI Informational Text → 5.RI Integration of Knowledge & Ideas
Grade 5 → Reading → RI Informational Text → 5.RI Range of Reading & Level of Text Complexity
Grade 5 → Reading → RI Informational Text → Texts Illustrating the Complexity, Quality, & Rang
Grade 5 → Reading → CCR College & Career Readiness Anchor Standards fo
Reviews:
School Library Journal (11/01/13)
Full Text Reviews:
School Library Journal - 11/01/2013 Gr 3–5—A well-designed infographic simultaneously conveys facts and presents their interrelationships in visual ways. With but rare exceptions (such as a graph of multiple star characteristics in Solar System, a representation of the water cycle in Weather, and the occasional pie chart elsewhere), the silhouettes and other figures in these volumes may be done in a pictorial graphic style but are really just illustrations or images inserted to add visual interest. However, each title does offer sheaves of basic information in particularly concentrated form, including topic-expanding closing spreads ("10 Ways to Live Green" in Life Science, for instance), and the resources lists are above average. - Copyright 2013 Publishers Weekly, Library Journal and/or School Library Journal used with permission.