  | Lines, bars and circles : how William Playfair invented graphs Author: Becker, Helaine | |
| Price: $6.50 | ||
Summary:
A picture-book biography of Scotland-born William Playfair (1759-1823) the inventor of the line graph, bar graph and pie chart.
| Illustrator: | Tremblay, Marie-Eve |
Reviews:
Kirkus Reviews (02/01/17)
School Library Journal (03/01/17)
Booklist (02/01/17)
The Bulletin of the Center for Children's Books (A) (00/05/17)
Full Text Reviews:
Booklist - 02/01/2017 It can be difficult to find a picture-book biography dedicated to an obscure ne’er-do-well who couldn’t keep a job, failed at numerous business ventures, and barely managed to avoid the guillotine during the French Revolution. Yet these events pretty much sum up the life of Scotsman William Playfair, the hopeless dreamer credited with inventing the bar graph, the pie chart, and the line graph. It may be difficult to realize that these representations had to be invented, since they’re so embedded into our modern data displays, or that they were dismissed for more than a century, since eighteenth-century Enlightenment doctrine deemed illustrations creative, unreliable flights of imagination. The accessible text manages to convey these abstract ideas while following Playfair’s unlucky circumstances, occasionally relying on inset-boxes to explain historical context (scientific method, the Industrial and French Revolutions). The humorous illustrations ease this story along for young audiences, and extensive endnotes fill in gaps for adults. This attractive package about an overlooked subject is a great choice to inspire nascent dreamers and makers. - Copyright 2017 Booklist.
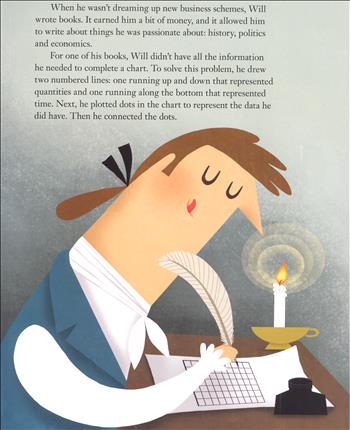
School Library Journal - 03/01/2017 Gr 1–4—A picture book biography of the inventor of the three most frequently used infographics: the line graph, the bar graph, and the pie chart. William Playfair (1759–1823) grew up in Scotland, was educated by his mathematician and scientist brother, and later worked for inventors Andrew Meikle and James Watt. So why don't more students know his name? The author suggests that even though Playfair was a creative thinker, he was not taken seriously during his lifetime because he was also a scoundrel and a schemer. Another reason is that scientists preferred numbers to Playfair's colorful visuals, which they saw as imaginative rather than scientific. It took more than 100 years for Playfair's ideas to become a popular way of displaying data. A mix of informative and witty illustrations add to the value of this educational, well-written work. (Drawings of Playfair's graphs enhance the narrative and also teach kids how to interpret said graphs.) Back matter further explains Playfair's life and his innovative methods of presenting material. VERDICT The author's evidence-based speculation about why Playfair's charts didn't initially catch on and the smart and playful art combine to produce a welcome option for STEM and biography collections.—Myra Zarnowski, City University of New York - Copyright 2017 Publishers Weekly, Library Journal and/or School Library Journal used with permission.